
Evaluation of EU Candidate and Potential Candidate Countries’ Economic Indicators with TOPSIS Method
Arş.Gör.Özge Çetiner tarafındanThis study was written in Turkish, and its translation was carried out by Young Diplomats. (Original study available at: https://dergipark.org.tr/tr/pub/cagsbd/article/816707?issue_id=58680 )
ABSTRACT:
The aim of this study is to evaluate the economic performance of candidate and potential candidate countries of the European Union (EU). In this context, the economic performances of seven countries including five candidates and two potential candidates of the EU, were ranked by using 2017 data and TOPSIS method which is the one of the Multi-Criteria Decision Making Analysis (MCDA). In order to rank countries according to their economic performance, Maastricht Economic Criteria has been taken into consideration. These criteria are equally weighted as they contain the functioning economic indicators of the EU and therefore they are the conditions that the EU expects from countries to implement. As a result of the ranking, it is determined that Turkey is the country with the highest performance.
Key Words: European Union, Maastricht Economic Criteria, Economic Performance, TOPSIS Method
JEL Code: N13, O10, C30
1. Introduction
The European Integration, which began to be established with six countries after World War II with the aim of ensuring economic cooperation among EU member countries, has now reached 28 member countries. This expansion process has required institutional reforms within the EU, as well as the application of certain criteria to the countries on the path to EU integration. In order to sustain economic development, the EU imposes two important economic criteria on member countries. These are the Copenhagen and Maastricht criteria. The Copenhagen criteria, which candidate countries must implement to become EU members, aim to ensure a competitive and functioning economy. The Maastricht criteria, on the other hand, are aimed at ensuring that member countries participate in the Economic and Monetary Union (EMU) and set minimum standards related to exchange rates, inflation, public debt, budget deficits, and interest rates. Therefore, these two criteria aim to increase competitiveness within the EU and contribute to achieving a better economy.
Within the scope of the EU enlargement policy, there are currently five candidate and two potential candidate countries. Since multiple criteria are considered in examining the economic performances of candidate and potential candidate countries, a multi-criteria decision-making (MCDM) method is used for analysis (Harker and Vargas, 1987, p. 1383). MCDM methods are used as subjective in terms of considering the opinions of decision-makers, while they are used as objective analysis methods in terms of being based on a mathematical algorithm (Çakır and Perçin, 2013, p. 450). MCDM methods are generally used to make the most accurate decision in problem processes where there are many different criteria and alternatives.
The aim of this study is to rank the economic performance levels of candidate and potential candidate countries for EU membership, taking into account the Maastricht Economic Criteria. In this context, using one of the MCDM methods, TOPSIS, five criteria were determined from the macroeconomic data of 2017, and the economic performances of the countries were evaluated. Within the scope of the study, five different criteria are considered to achieve a better economy on the path to EU membership based on the Maastricht criteria. These criteria are public debts, unemployment rates, budget deficits, GDP per capita, and inflation. This research is important in terms of evaluating the current situations of the countries and making correct decisions. Additionally, the study's coverage of seven different countries will allow for comparisons between the countries and reveal their situations relative to each other.
The study consists of three sections. In the first section, the EU process, which began as an economic peace project, is described along with the Maastricht criteria, which are deemed necessary to be examined as economic performance indicators for participation in the EMU, and the processes of candidate and potential candidate countries on the path to the Union are discussed. The second section is dedicated to a literature review to demonstrate the uniqueness of this study in terms of both the countries examined and their current data. In the final section, the seven countries are analyzed using the TOPSIS method based on the five criteria and ranked according to their current situations.
2. Conceptual Framework
2.1. The European Integration Process and the Current Situations of Countries on the Path to the European Union
The process of EU integration, which began as an attempt to rescue economies that were disrupted after World War II, started with the establishment of the European Coal and Steel Community as a result of the Paris Agreement signed in 1951, focusing on common market cooperation in two important areas, coal and steel, which were raw materials of war, based on economic consensus and the representation of peace. With the Rome Agreement, which came into force in 1958, the establishment of a customs union was aimed among Belgium, Germany, France, Italy, Luxembourg, and the Netherlands, including various goods and services, leading to the establishment of the European Economic Community (EEC). The failure of these countries to achieve the expected economic development initiated the implementation of the 1987 Single European Act to remove economic barriers among member countries and increase competitiveness (Samsun, 2003, p. 59).
This economic cooperation created an opportunity for other countries as well, leading to the expansion process of the EEC, which started with six countries. In this framework, the first expansion occurred in 1973 with the participation of Denmark, the United Kingdom, and Ireland, and the second expansion took place in the 1980s with the participation of Greece, Spain, and Portugal.
Table 1. Candidate and Potential Candidate Countries for the EU
|
Candidate Countries for the EU |
Potential Candidate Countries for the EU |
|
Albania Montenegro North Macedonia Serbia Turkey |
Kosovo Bosnia-Herzegovina |
Turkey, as one of the candidate countries, applied for partnership in the EEC, which was established in 1958, in 1959. The Ankara Agreement of 1963 was signed as a partnership agreement, initiating the first membership stage (Preparation Period) in the form of Preparation Period, Transition Period, and Final Period. The goal of reducing economic disparities was replaced in 1973 by the Transition Period, which aimed to ensure the free movement of people, industrial and agricultural products, and the completion of the Customs Union. Before transitioning to the Final Period, Turkey applied for membership in 1987 but was met with a negative outcome. In accordance with the targeted year of 1995 for the Final Period, it was decided at the Central Council meeting that the Customs Union would start in 1996. Turkey's candidacy was accepted at the 1999 Helsinki Summit. Subsequently, at the 2004 Brussels Summit, it was decided that Turkey, which was stated to meet the political criteria, would begin full membership negotiations in 2005. Currently, 16 chapters have been opened for negotiation, but only one has been temporarily closed (Republic of Turkey Ministry of Foreign Affairs EU Presidency, 2019a).
After Albania was mentioned as a potential candidate country at the 2003 Thessaloniki Summit, it applied for membership in 2009, and in 2010, it was requested to make reforms in 12 key areas for membership, and it gained candidate status in 2014. The 2015 and 2016 Progress Reports indicated that developments occurred in key areas and progress was made in political criteria. It was also recommended that negotiations would be initiated on the condition that improvements in the implementation of judicial reform continued (Economic Development Foundation, 2018). In 2018, the European Commission and the EU General Affairs Council stated that negotiations could begin (Republic of Turkey Ministry of Foreign Affairs EU Presidency, 2019b).
North Macedonia, which applied for membership in 2004, gained candidate status in 2005. However, despite the European Commission recommending the start of accession negotiations in its 2014, 2015, and 2016 Progress Reports, negotiations could not begin due to the naming issue with Greece. With the signing of the Prespa Agreement on June 17, 2019, the acceptance of the name "Republic of North Macedonia" provided a consensus between the parties, and it was stated that negotiations could begin (Republic of Turkey Ministry of Foreign Affairs EU Presidency, 2019c).
Serbia, criticized for not cooperating sufficiently with the International Criminal Tribunal for the former Yugoslavia, overcame significant obstacles to EU membership following its membership application in 2009, with the capture of those responsible for the Srebrenica massacre and the massacres in the Krajina region of Croatia in 2011. The European Commission proposed granting candidate country status to Serbia in light of its cooperative stance during this process. Serbia was declared a candidate country in 2012, and it was stated that if relations with Kosovo, which it does not recognize as an independent country, improved, accession could proceed.
Greece demands the change of the name of the Republic of Macedonia due to the region of Macedonia located in its territory, otherwise, it argues that it could claim rights in the region with the same name and that the Macedonian identity could be stolen, thus opposing the negotiation process that could begin without resolving the issue. Various countries, like Turkey, recognize the region by the name "Republic of Macedonia," while Macedonia was accepted into the UN under the name "Former Yugoslav Republic of Macedonia" (Euronews, 2019; Çolak, 2016, pp. 233-234).
It has been stated that negotiations will begin. In this process, negotiations conducted under the mediation of the EU have led to the normalization of relations, and negotiations began in 2014. The long delay in forming a government in Bosnia and Herzegovina, one of the potential candidate countries waiting to apply for EU membership, after the October 2010 elections has delayed the necessary reforms in the EU process. In 2012, the conditions for the entry into force of the Stabilization and Association Agreement, required to apply for membership, were specified with the High-Level Dialogue on the Accession Process between Bosnia and Herzegovina, and a roadmap was drawn in this direction. Following the limited progress in the political criteria mentioned in the 2013 and 2014 Progress Reports, the Stabilization and Association Agreement entered into force in 2015. Subsequently, on February 15, 2015, Bosnia and Herzegovina applied for full membership, and the Commission was requested to prepare a membership opinion (Economic Development Foundation, 2018).
Another potential candidate country, Kosovo, despite gaining independence in 2008, is not recognized by Spain, Greece, South Cyprus, Romania, and Slovakia, which creates problems in its relationship with the EU. However, with the progress made regarding Kosovo's EU membership application, it was decided in 2013 to start negotiations for the Stabilization and Association Agreement. The negotiations were completed in 2014, the agreement was signed in 2015, and it entered into force in 2016. Kosovo is expected to make improvements in areas such as the rule of law, judicial independence, combating corruption, unemployment, and electoral system reform (Economic Development Foundation, 2018).
The EU, which starts with an economic basis and expands to include political cooperation, is a supranational structure that specifies the criteria to be applied to member, candidate, and potential candidate countries. In this context, the Copenhagen Criteria include the economic, political, and compliance conditions expected to be applied for the full membership of candidate and potential candidate countries to the EU. However, in addition to the Copenhagen criteria, the Maastricht criteria, which include the conditions for resolving differences among member countries and ensuring participation in the Economic and Monetary Union (EMU), are another important point in this process. The economic criteria of the Copenhagen criteria are based on a functioning and competitive free market economy, while the Maastricht criteria concern issues such as the country's financial situation, inflation rate, and exchange rate (Yavuz and Yavuz, 2015, pp. 84-85). Therefore, both criteria actually aim for the same thing in different ways: economic development. In other words, improvements made towards the Maastricht criteria will also have a positive impact on the membership process.
The Maastricht criteria, which indicate the necessary economic performance for member countries to be able to participate in the EMU (to use the same currency), are as follows:
- Inflation Rate: The difference between the average annual inflation rates of the member country and the three countries with the lowest inflation in the community should not exceed 1.5 points.
- Public Debt: The ratio of the member country's government debt to Gross Domestic Product (GDP) should not exceed 60%.
- Budget Deficit: The ratio of the member country's budget deficit to its GDP should not exceed 3%.
- Interest Rate: The long-term interest rates applied in any member country should not exceed the interest rates of the three countries with the best performance in price stability by more than two points over a 12-month period.
- Exchange Rate: The member country's currency should not have been devalued against another member country's currency in the last two years (Karluk and Tonus, 1998, pp. 274-275).
Since a wide variety of criteria are evaluated in examining the economic performances of candidate and potential candidate countries for the EU, AHP methods are suitable for analysis. Based on this, this study aims to rank five candidate and two potential candidate countries subject to the criteria for achieving a better economy on the path to the EU using the TOPSIS method based on the Maastricht criteria.
In the literature, there are many studies using the TOPSIS method, which is one of the AHP methods, to rank economic performance (for example, Hallett and Lewis, 2007; Turan et al., 2010; Özden, 2011; Urfalıoğlu and Genç, 2013; Demirtaş and Masca, 2014; Işık et al., 2016; Balcerzak and Pietrzak, 2016; Eyüboğlu et al., 2016; Despotovic and Durkalic, 2017; Sevgin and Kundakçı, 2017; Kiszkiel, 2017; Li, 2018; Dinçer and Yüksel, 2018; Ela et al., 2018; Ture et al., 2019). Hallett and Lewis (2007) argued in their studies that the Maastricht criteria are irrelevant (invalid) by focusing on the debt dynamics of eight new EU members in Central and Eastern Europe and that they could harm any potential historical background for the Eurozone during the process of catching up. They also addressed the strong effects of nominal criteria that complicate the achievement of financial criteria.
As a result of the study, it has been revealed that it will be more difficult for all countries to limit debt growth according to the Maastricht criteria. However, noting that this effect varies significantly among countries; it has been stated that if nominal criteria come to the forefront, the policy tools required to ensure Euro convergence will be in the hands of individual member states, which means that the principle of commitment can be applied to Euro membership.
Turan et al. (2010) examined candidate countries for the EU and countries before EU membership using the TOPSIS method based on certain criteria (GDP, unemployment, current account balance, inflation). As a result, it was emphasized that the EU is not only an economic union but also a political union, highlighting that Turkey, the 15th largest economy in the world, is still waiting to be accepted into the EU.
Özden (2011) ranked the development levels of EU member and candidate countries using the economic indicators and data from 2009 with the TOPSIS method. According to the research results, Turkey has the lowest performance for the inflation criterion, while Ireland has the highest performance. While Ireland has the best performance in the ratio of exports to imports, the lowest is Cyprus. The highest per capita national income is in Luxembourg, while the lowest is in Bulgaria. According to the unemployment rate, Spain has the lowest performance, while the Netherlands has the highest performance. In short, the country with the highest performance is Luxembourg, while the lowest performance belongs to Greece. Turkey ranked 27th among 29 countries.
Urfalıoğlu and Genç (2013) examined Turkey's economic situation in the EU using the TOPSIS method. According to the comparison of Turkey's and EU member states' economic performances, Turkey ranks 13th.
Demirtaş and Masca (2014) aimed to rank 66 countries based on macroeconomic and governance performances to compare the ratings of credit rating agencies with countries' credit scores. The credit ratings of 66 developed and developing countries were determined based on governance and macroeconomic data from 2010, and a country ranking was established. As a result, it was stated that credit rating agencies consider Institutional and Governance Factors, and that for developing countries, improving only macroeconomic indicators without improving Institutional and Governance Factors is a temporary situation for increasing credit ratings.
Işık etc. (2016) utilized the TOPSIS method to analyze the export performance of emerging market economies in 2013, ranking 22 countries based on their performances. As a result, the most important indicator with the AHP method was found to be the export of high technology products (HTECH). As a result of the analysis conducted using the TOPSIS method, the Philippines, being the highest in the HTECH indicator, became the best-performing country in terms of export performance as of 2013, influenced by the determined weights.
Balcerzak and Pietrzak (2016) aimed to evaluate the progress made by "new" member states after EU membership, establishing two ranking groups for EU countries during the years 2004-2012, one at the highest level of human capital quality and the other at the lowest level. As a result of the comparison of rankings in 2004 and 2012 using the TOPSIS method, it was revealed that most of the "new" member states made significant progress during the analyzed period. It was also emphasized that the quality of human capital is affected by many determinants that can be changed by government policy.
Eyüboğlu (2016) comparatively analyzed the macroeconomic performances of developing countries (Turkey, Poland, Mexico, Chile, Malaysia, Hungary, Indonesia, China, Argentina, and Brazil) between 2003 and 2013 using the TOPSIS method. As a result, it was determined that the countries with the highest performance were Malaysia and China. While Turkey ranked fifth in 2003, by 2013, it ranked last among 10 countries.
Despotovic and Durkalic (2017) conducted a study based on theoretical and empirical foundations, ranking EU member countries from 34 countries according to budget deficit and candidate countries for EU membership based on public finance criteria, demonstrating the causality between the EU and candidate countries for EU membership.
Sevgin and Kundakçı (2017) ranked the economic indicators (per capita income, inflation, unemployment rate, export-import coverage ratio, public debts, budget deficit) of the 28 EU member countries and candidate Turkey using the TOPSIS and MOORA methods according to their levels of development. According to this ranking, Luxembourg, Sweden, and Denmark occupy the top three positions, while Croatia, Bulgaria, Slovenia, Greece, and Turkey are at the bottom.
Kiszkiel (2017) prepared a multi-criteria ranking of OECD countries in terms of economic inequality based on sample indicators used by organizations, using the TOPSIS method. As a result of the research, it was found that developed countries like the USA and Israel are compared to Chile, Mexico, and Turkey.
It has been observed that it is located just below. In addition, all these countries constitute the first class of countries with the highest value of the synthetic indicator and therefore the countries with the greatest economic diversityt has been observed that it is located just below. In addition, all these countries constitute the first class of countries with the highest value of the synthetic indicator and therefore the countries with the greatest economic diversity. Li (October 2018) has made a financial and economic assessment of the EU member states and proposed an additional model to determine the role of countries in the world system. The results show that a group of states such as Germany, the United Kingdom, the Netherlands, Italy, Belgium, Denmark and Sweden are connected to the core of the European world system. EU member states Romania and Bulgaria, Poland, Portugal, Slovakia and Slovenia, as well as the three Baltic States (Estonia, Latvia and Lithuania), have also become acceptable as peripheral states in the European world.U member states Romania and Bulgaria, Poland, Portugal, Slovakia and Slovenia, as well as the three Baltic States (Estonia, Latvia and Lithuania), have also become acceptable as peripheral states in the European world. Dinçer and Yüksel (2018) examined the G20 economies on nine criteria using the TOPSIS Method and reached the conclusion that Italy has the best performance as a result of the analysis, while Japan, the United States and Korea are other countries with high performance. Due to the financial sector-based performance indices, Argentina ranked last, while Mexico, Indonesia and Turkey were the countries with low performance results. Ela et alue to the financial sector-based performance indices, Argentina ranked last, while Mexico, Indonesia and Turkey were the countries with low performance results. Ela et al. (In his 2018 study), he analyzed ue to the financial sector-based performance indices, Argentina ranked last, while Mexico, Indonesia and Turkey were the countries with low performance results. Ela et al. (In histudy), he analyzed the performances of Turkey and EU countries in 2015 with macroeconomic criteria (growth, inflation, unemployment and current account balance/GDP) through the TOPSIS method. As a result of the analysis, the countries with the highest performance were Ireland, Cyprus and Poland, while the countries with the lowest performance in terms of macroeconomic aspects were Turkey, Austria and Belgium. Ture et al. (The 2019 study) provides an unbiased assessment of the performance of the 27 EU member states in terms of the EU 2020 Strategy. 2019 study) provides an unbiased assessment of the performance of the 27 EU member states in terms of the EU 2020 Strategy. In this context, they ranked the countries according to vari2019 study) provides an unbiased assessment of the performance of the 27 EU member states in terms of the EU 2020 Strategy.
3. Purpose and Method of the Study
3.1. The Purpose of the Study
The aim of this study is to measure the economic performance of seven countries, five candidates and two potential candidates for the EU, using TOPSIS, one of the MCDM methods, with 2017 data.aim of this study is to measure the economic performance of seven countries, five candidates and two potential candidates for the EU, using TOPSIS, one of the MCDM methods, with 2017 data. In this direction, the economic performances of the countries considered were evaluated according to five determined criteria and a ranking was ysis.
3.2. TOPSIS Method
The TOPSIS method was developed by Yoon and Hwang in 1981. In this method, positive and negative ideal solution points are determined and a choice is made among the alternativeshe TOPSIS was developed by Yoon and Hwang in 1981. In this method, positive and negative ideal solution points are determined and a choice is made among the alternatives. With this method, the calculation of the positive ideal solution (a solution that he TOPSIS method was developed by Yoon and Hwang in 1981. In this method, positive and negative ideal solution points are determined and a choice is made among the alternatives. With this method, the calculation of the positive ideal solution (a solution that provides the criteria with the best values) and the negative ideal solution (a solution that provides the criteria with the worst values) is made (Başkaya and Öztürk, 2011, p. 84). As a result of the analysis, the best alternative is the one that is closest to the positive ideal solution and the one that is farthest from the negative ideal solution (Wang and Elhag, 2006, p. 310). The application stages of the TOPSIS method, which includes a solution process consisting of six steps, are as follows (Jahanshahloo et al. 2006, p. 1378; Çakır and Perçin, 2013, p. 452 – 453 ).
Step 1: Normalization of the decision matrix:
In this step, the values of each criterion are normalized by dividing them by the square root of the sum of squares of those criteria.
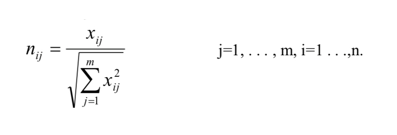
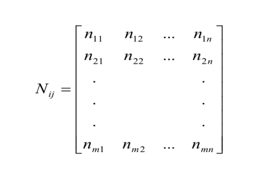
It is calculated as the normalized value ( nᵢⱼ ). The normalized decision matrix is as follows.
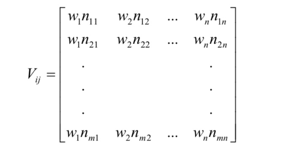
Step 2: Weighting of the normalized decision matrix:
After determining the weight values (Wᵢ) related to the evaluation factors, the values in each column of the matrix are multiplied by the weight value to obtain the weighted normalized value Vᵢⱼ . The Vᵢⱼ matrix is as follows.
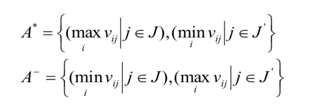
Step 3: Calculation of positive and negative ideal solution points:
The positive ideal solution point A⁺ shows the best performance values in the weighted normalized matrix, while the negative ideal reference point A⁻ expresses the worst performance values in the same matrix.
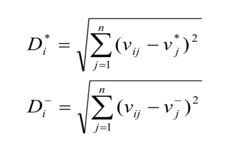
Step 4: Calculation of distances to positive and negative ideal solution points:
The values Dᵢ* , showing the Euclidean distances of the alternatives to the positive ideal solution points, and Dᵢ⁻, indicating their distances to the negative ideal solution points, are calculated as follows.
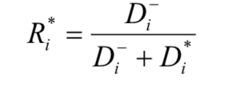
Step 5: Calculation of relative closeness to the ideal solution point:
Rᵢ*, the closeness coefficient, shows the proximity of the alternatives to the positive ideal solution point and is calculated through the following equation.
Step 6: Ranking of alternatives:
The closeness coefficients obtained in the fifth step indicate the preference ranking of each alternative. In the fifth step, the distances of each alternative from the positive ideal Dᵢ*, the distance from the negative ideal solution Dᵢ⁻ , and the relative closeness of each decision point to the ideal solution Rᵢ* are calculated. The performance rankings of the alternatives are established based on the descending order of the Rᵢ* values. Consequently, the alternative exhibiting the highest Rᵢ* value is assigned the top rank.
4. Findings
The countries covered in the analysis and the alternative numbers assigned to the countries are shown in the table below.
Table 2. Countries Covered by the Analysis
|
Country Number |
Country Name |
|
A1 |
Albania |
|
A2 |
Montenegro |
|
A3 |
North Macedonia |
|
A4 |
Serbia |
|
A5 |
Türkiye |
|
A6 |
Chuang |
|
A7 |
Bosnia and Herzegovina |
There are many macroeconomic indicators for measuring the economic performance of countries. Within the scope of this study, candidate and potential candidate countries to the EU are considered, which are also used in similar studies (Turan etc., 2010; Özden, 2011; Despotović and Durkalić, 2017) There are many macroeconomic indicators for measuring the economic performance of countries. Within thehere are many macroeconomic indicators for measuring the economic performance of countries. Maastricht Criteria were taken into consideration. Although the Maastricht Criteria contain the economic indicators required to join the EPB, this situation is similar to the EU membership criteria. Five economic criteria were used in the scope of the analysis. The weight of each of these criteria was determined as 1/5. The criteria, their weights and impact on performance are shown in Table 3.
Table 3. Criteria and Weight Values
|
CRİTERİON NUMBER |
CRİTERİON NAME |
CRİTERİA WEİGHT |
TO PERFORMANCE EFFECT |
|
K1 |
Public debt/gsyih |
%20 |
Negative |
|
K2 |
Unemployment rate |
%20 |
Negative |
|
K3 |
Budget deficit/gsyih |
%20 |
Negative |
|
K4 |
Gsyih/population |
%20 |
Positive |
|
K5 |
Inflation |
%20 |
negative |
The criteria that have a negative impact on the performance were transformed and included in the analysis as if they had a positive impact. For this transformation process, the values related to the criteria (xᵢⱼ) (were divided by 1 to obtain the 1/he criteria that have a negative impact on the performance were transformed and included in the analysis as if they had a positive impact. For this transformation process, the values related to the criteria (xᵢⱼ) were divided by 1 to obtain the 1/xᵢⱼ value. In the rows of the decision matrix, there are alternatives representing the countries whose economic performances want to be ranked, and criteria representing the economic indicators to be used in decision-making in the columns. First of all, the Decision Matrix created for the purpose of applying the TOPSIS method, 1. it is normalized with the help of the equation in the step. The normalized decision matrix is as in Table 4.
Table 4. Normalized Decision Matrix
|
Country number |
K1 |
K2 |
K3 |
K4 |
K5 |
|
A1 |
0,1783821 |
0,437758 |
0,040948 |
0,258906 |
0,233448 |
|
A2 |
0,1856063 |
0,354869 |
0,056400 |
0,446614 |
0,275135 |
|
A3 |
0,3016690 |
0,288331 |
0,017583 |
0,310688 |
0,366847 |
|
A4 |
0,2029970 |
0,416478 |
0,033213 |
0,362469 |
0,233448 |
|
A5 |
0,4210574 |
0,550210 |
0,996396 |
0,608430 |
0,069403 |
|
A6 |
0,7178268 |
0,197930 |
0,016515 |
0,233016 |
0,513586 |
|
A7 |
0,3300810 |
0,289724 |
0,025549 |
0,284797 |
0,641982 |
Then, in order to obtain the weighted normalized matrix, the normalized values shown in Table 4 were multiplied by the weight (wj) values. The values related to the matrix are shown in Table 5.
Table 5. Weighted Normalized Matrix
|
COUNTRY NUMBER |
K1 |
K2 |
K3 |
K4 |
K5 |
|
A1 |
0,0356764 |
0,087552 |
0,00819 |
0,051781 |
0,04669 |
|
A2 |
0,0371213 |
0,070974 |
0,01128 |
0,089323 |
0,055027 |
|
A3 |
0,0603338 |
0,057666 |
0,003517 |
0,062138 |
0,073369 |
|
A4 |
0,0405994 |
0,083296 |
0,006643 |
0,072494 |
0,04669 |
|
A5 |
0,0842115 |
0,110042 |
0,199279 |
0,121686 |
0,013881 |
|
A6 |
0,1435654 |
0,039586 |
0,003303 |
0,046603 |
0,102717 |
|
A7 |
0,0660162 |
0,057945 |
0,00511 |
0,056959 |
0,128396 |
In the next step, the largest and smallest values in each column of the weighted normalized matrix were selected to calculate the positive and negative ideal solution values. The values are shown in Table 6.
Table 6. Positive and Negative Ideal Solution Values
|
solution values |
K1 |
K2 |
K3 |
K4 |
K5 |
|
A+ |
0,1435654 |
0,110042 |
0,199279 |
0,121686 |
0,128396 |
|
A- |
0,0356764 |
0,039586 |
0,003303 |
0,046603 |
0,013881 |
As seen in Table 6; in the ratio of public debt to GDP (K1), the positive ideal solution is represented by Kosovo (A6), and the negative ideal solution is represented by Montenegro (A2). In other words, considering this criterion, the country with the best performance is Kosovo (A6) with a score of 0.1435654, while the country with the lowest performance is Montenegro (A2) with a score of 0.0356764. Turkey's (A5) performance score according to this criterion is 0.0842115.
When examining unemployment rates (K2), it is seen that the country with the best performance is Turkey (A5) with a score of 0.110042, while the country with the lowest performance is Kosovo (A6) with a score of 0.039586. In the ratio of budget deficit to GDP (K3), the positive ideal solution is represented by Turkey (A5) with a score of 0.199279, and the negative ideal solution is represented by Kosovo (A6) with a score of 0.003303. In the ratio of GDP to population (K4), the positive ideal solution is represented by Turkey (A5) with a score of 0.121686, and the negative ideal solution is represented by Kosovo (A6) with a score of 0.046603. Finally, when considering inflation rates (K5), the country with the best performance is Bosnia and Herzegovina (A7) with a score of 0.128396, while the country with the lowest performance is Turkey (A5) with a score of 0.013881.
Lastly, the performance rankings of the alternatives are arranged in order of the magnitude of Rᵢ* values. The ranking regarding overall performances is shown in Table 7.
Table 7. Ideal Separation Solutions and Relative Proximity to Ideal Solution
|
COUNTRY |
Dᵢ* |
Dᵢ⁻ |
Rᵢ* |
RANKING |
|
A1-ALBANIA |
0,245405 |
0,058548 |
0,19262 |
7 |
|
A2-MONTENEGRO |
0,252807 |
0,067594 |
0,210966 |
5 |
|
A3-NORTH MACEDONIA |
0,233597 |
0,068667 |
0,227175 |
4 |
|
A4-SERBIA |
0,239838 |
0,060767 |
0,20215 |
6 |
|
A5-TÜRKIYE |
0,128983 |
0,226636 |
0,637299 |
1 |
|
A6-KOSOVA |
0,222862 |
0,139757 |
0,385409 |
2 |
|
A7-BOSNIA AND HERZEGOVINA |
0,224987 |
0,120341 |
0,348483 |
3 |
As seen in Table 7, the country with the highest performance is Turkey with a score of 0.637299. Following Turkey are Kosovo with a score of 0.385409, and Bosnia and Herzegovina with a score of 0.348483.
26 0,227175 points with North Macedonia, 0,210966 points with Montenegro, 0,20215 points with Serbia, and 0,19262 points with Albania, which has the lowest performance.
4. Conclusion
The examination of the performances of countries on the path to the EU and the determination of differences between countries serve as a guide in the formulation of EU policies and necessary structural arrangements. At the same time, the examination of the current economic situation can help countries see their standings among other countries and improve their economic performances on the path to the EU. In this study, the economic performances of a total of seven candidate and potential candidate countries for the EU were attempted to be measured using one of the MCDM methods, TOPSIS, with economic data from the year 2017, and the countries were ranked. While determining the economic criteria considered in the analysis, the Maastricht criteria of the EU were taken into account. As a result of the analyses, it was observed that the country with the highest economic performance is Turkey, while the one with the lowest is Albania.
In the study, when examining the decision matrix of Turkey, which ranks first, the ratio of Public Debt to GDP, unemployment rate, the ratio of Budget Deficit to GDP, and the ratio of GDP to population have ensured that Turkey ranks among the top among the candidate member countries of the EU. On the other hand, it was determined that the criterion where Turkey's performance is the lowest is inflation. When countries are evaluated based on the criteria, the best performance in the ratio of Public Debt to GDP belongs to Kosovo, while the lowest performance belongs to Montenegro. When unemployment rates are examined, the country with the best performance is Turkey, and the country with the lowest performance is Kosovo. In the ratio of Budget Deficit to GDP, the country with the best performance is Turkey, while the lowest is Kosovo. In the ratio of GDP to Population, the highest score belongs to Turkey, and the lowest score belongs to Kosovo. Finally, when inflation rates are examined, it was determined that the country with the best performance is Bosnia and Herzegovina, while the country with the lowest performance is Turkey.
There are three important findings that stand out in the study. The first is that although Turkey's economic performance in terms of the examined criteria is better than the other six countries among the potential candidates, the EU membership process, the opened chapters, and the initiation phase of negotiations progress more slowly. This situation shows that non-economic factors are significant obstacles to Turkey's membership. The second is that when evaluated in terms of overall economic performance, the potential candidate countries ranked second and third, Kosovo and Bosnia and Herzegovina, are in a better position than the existing candidate countries outside Turkey. Therefore, although Kosovo, which gained independence in 2008, and Bosnia and Herzegovina, which has problems in forming a government, started the EU integration process late for political reasons, they are economically successful among the four candidate countries. Lastly, the lack of a significant difference in the overall economic performance scores of other candidate countries outside Turkey suggests that other criteria will differentiate these countries during their EU membership process.
When the economic indicators and weight levels used in the study are changed, the country rankings will also change, so measuring performance with different indicators in future studies will contribute to the literature. Additionally, comparing the results obtained using different MCDM methods will be guiding for future studies in this area.
References:
Balcerzak, A. P., & Pietrzak, M. P. (2016). TOPSIS analysis of changes of quality of human capital in European Union countries. In ICEM 2016 International Scientific Conference Economics and Management. Smart and Efficient Economy: Preparation for Future Innovative Economy. 21st International Scientific Conference: Proceedings of Selected Papers (pp. 80–85).
Başkaya, Z., & Öztürk, B. (2011). Bulanık TOPSIS ile satış elemanı adaylarının değerlemesi. Business and Economics Research Journal, 2(2), 77–100.
Bilgili, E. (1998). Avrupa Topluluğu üyeleri ve Türkiye'nin Avrupa Para Birliği için öngörülen kriterler açısından değerlendirilmesi. Erciyes Üniversitesi İktisadi ve İdari Bilimler Fakültesi Dergisi, 13, 51–69.
Çakır, S., & Perçin, S. (2013). Çok kriterli karar verme teknikleriyle lojistik firmalarında performans ölçümü. Ege Akademik Bakış Dergisi, 13(4), 449–459.
Çolak, Y. (2016). Makedonya’nın isim sorunu: Sebepleri ve Türkiye’nin Balkanlar politikasına olan etkileri bakımından bir inceleme. International Turkic World Educational Sciences and Social Sciences Congress, 229–239.
Demirtaş, G., & Masca, M. A. (2014). Comparison of country performances with sovereign credit ratings using the TOPSIS model. The Empirical Economics Letters, 13(6), 645–654.
Despotović, D., & Durkalić, D. (2017). Analysis of budget deficit in the candidate countries for EU membership. Serbian Journal of Management, 12(2), 237–253.
Dinçer, H., & Yüksel, S. (2018). Financial sector-based analysis of the G20 economies using the integrated decision-making approach with DEMATEL and TOPSIS. In Emerging Trends in Banking and Finance (pp. 210–223). Springer.
Ela, M., Doğan, A., & Uçar, O. (2018). Avrupa Birliği ülkeleri ve Türkiye’nin makroekonomik performanslarının TOPSIS yöntemi ile karşılaştırılması. Osmaniye Korkut Ata Üniversitesi İktisadi ve İdari Bilimler Fakültesi Dergisi, 2(2), 129–143.
Euronews. (2019). Makedonya ve Yunanistan arasında çözülemeyen isim krizinde son. https://tr.euronews.com/2019/01/10/yunanistan-makedonya-ismine-neden-itiraz-ediyor-
Eyüpoğlu, K. (2016). Comparison of the financial performances of developing countries’ banking sectors with TOPSIS method. Ordu Üniversitesi Sosyal Bilimler Araştırmaları Dergisi, 220–236.
Hallett, A. H., & Lewis, J. (2007). Debt, deficits, and the accession of the new member states to the euro. European Journal of Political Economy, 23(2), 316–337.
Harker, P. T., & Vargas, L. G. (1987). The theory of ratio scale estimation: Saaty’s analytic hierarchy process. Management Science, 33(11), 1383–1403.
Işık, N., Engeloğlu, Ö., & Karaoğlan, S. (2018). Gelişmekte olan piyasa ekonomilerinin ihracat performansının Bulanık AHP ve TOPSIS yöntemi ile değerlendirilmesi. Anadolu Üniversitesi Sosyal Bilimler Dergisi, 18(3), 113–128.
İktisadi Kalkınma Vakfı. (2018). Diğer aday ve potansiyel aday ülkeler. https://www.ikv.org.tr/ikv.asp?ust_id=32&id=282
Jahanshahloo, G. R., Lotfi, F. H., & Izadikhah, M. (2006). An algorithmic method to extend TOPSIS for decision-making problems with interval data. Applied Mathematics and Computation, 175(2), 1375–1384.
Karluk, R., & Tonus, Ö. (1998). Avrupa Para Birliği, Euro ve geleceği. Anadolu Üniversitesi İİBF Dergisi, 14(1–2), 261–293.
Kiszkiel, Ł. (2017). Application of TOPSIS method for the evaluation of economic inequality in OECD countries. Studies in Logic, Grammar and Rhetoric, 50(1), 165–179.
Li, C. (2018). Evaluation of the financial and economic development of the European Union member states on basis of multiple indicators changed to multiple objectives. Economics and Management, 21(4), 19–32.
Özden, Ü. H. (2011). TOPSIS yöntemi ile Avrupa Birliğine üye ve aday ülkelerin ekonomik göstergelere göre sıralanması. Trakya Üniversitesi Sosyal Bilimler Dergisi, 13(2), 215–236.
Samsun, N. (2003). 10. yılında Avrupa Tek Pazarı. Maliye Dergisi, 143, 58–70.
Sevgin, H., & Kundakcı, N. (2017). TOPSIS ve MOORA yöntemleri ile Avrupa Birliği’ne üye olan ülkelerin ve Türkiye’nin ekonomik göstergelere göre sıralanması. Anadolu Üniversitesi Sosyal Bilimler Dergisi, 17(1), 87–108.
T.C. Dışişleri Bakanlığı Avrupa Birliği Başkanlığı. (2019a). Türkiye-AB ilişkilerinin tarihçesi. https://www.ab.gov.tr/turkiye-ab-iliskilerinin-tarihcesi_111.html
T.C. Dışişleri Bakanlığı Avrupa Birliği Başkanlığı. (2019b). Arnavutluk. https://www.ab.gov.tr/arnavutluk_49992.html
T.C. Dışişleri Bakanlığı Avrupa Birliği Başkanlığı. (2019c). Kuzey Makedonya. https://www.ab.gov.tr/makedonya_267.html
Turan, G., Eker, İ., & Pekar, J. (2010). Selection with TOPSIS method among EU candidate and pre-accession countries. Ekonomické Rozhľady/Economic Review, 39(4), 473–480.
Ture, H., Dogan, S., & Kocak, D. (2019). Assessing Euro 2020 strategy using multi-criteria decision making methods: VIKOR and TOPSIS. Social Indicators Research, 142(2), 645–665.
Urfalıoğlu, F., & Genç, T. (2013). ÇKKV teknikleri ile Türkiye’nin ekonomik performansının Avrupa Birliği üye ülkeleri ile karşılaştırılması. Marmara Üniversitesi İİBF Dergisi, 35(2), 329–360.
Wang, Y. M., & Elhag, T. M. (2006). Fuzzy TOPSIS method based on alpha level sets with an application to bridge risk assessment. Expert Systems with Applications, 31(2), 309–319.
Yavuz, H., & Yavuz, S. (2015). Türkiye’nin AB’ye üyelik sürecinin mali göstergeler açısından AB’nin yeni üye ülkeleriyle karşılaştırılması. Sakarya İktisat Dergisi, 4(2), 81–94.
Eurostat. (n.d.). Database. https://ec.europa.eu/eurostat/data/database
Eurostat. (n.d.). Statistical report. https://ec.europa.eu/eurostat/documents/3217494/9799207/KS-GO-19-001-EN-N.pdf